Today Steph discusses how buyers and sellers are experiencing the spring/summer real estate market in Nashville.
Understanding The Metrics
Looking to gain a better understanding of the current market conditions? By analyzing the May metrics for homes with a ‘Nashville” address , you can make informed decisions when buying or selling a property. So, let’s dive right in!
First, let’s talk about the “Months Supply of Inventory.” This metric represents the number of months it would take to sell all the current listings in a given market. In our case, the months supply of inventory is currently at 2.83 months. This means that if no new listings were added to the market, it would take approximately 2.83 months to sell all the existing properties. A lower number typically indicates a seller’s market, where demand outweighs supply, and 2.83 is a low number.
Next, let’s consider the “12-Month Change in Months of Inventory,” which is at +44.39%. This metric compares the current month’s supply of inventory to the same period last year. In this case, we see a significant increase compared to the previous year, indicating that the market has become more saturated with listings, giving buyers more options to choose from. However, this grader inventory hasn’t had the cooling effect you might expect.
Moving on, we have the “Median Days Homes are On the Market,” which stands at 46 days. This metric tells us the average number of days a property stays on the market before it gets sold. With a median of 46 days, it suggests that properties in this market are selling relatively quickly. This is good news for sellers who are looking to make a timely transaction, but also that buyers can’t wait too long.
Now, let’s discuss the “List to Sold Price Percentage,” which is currently at 98.1%. This metric measures the percentage of the listing price that the property ultimately sells for. A higher percentage indicates that sellers are receiving offers close to their asking price. With a list to sold price percentage of 98.1%, it suggests that buyers and sellers are finding a reasonable middle ground during negotiations. Beautiful homes and well-price homes are the exception. 21% of the market sold for OVER the asking price in May.
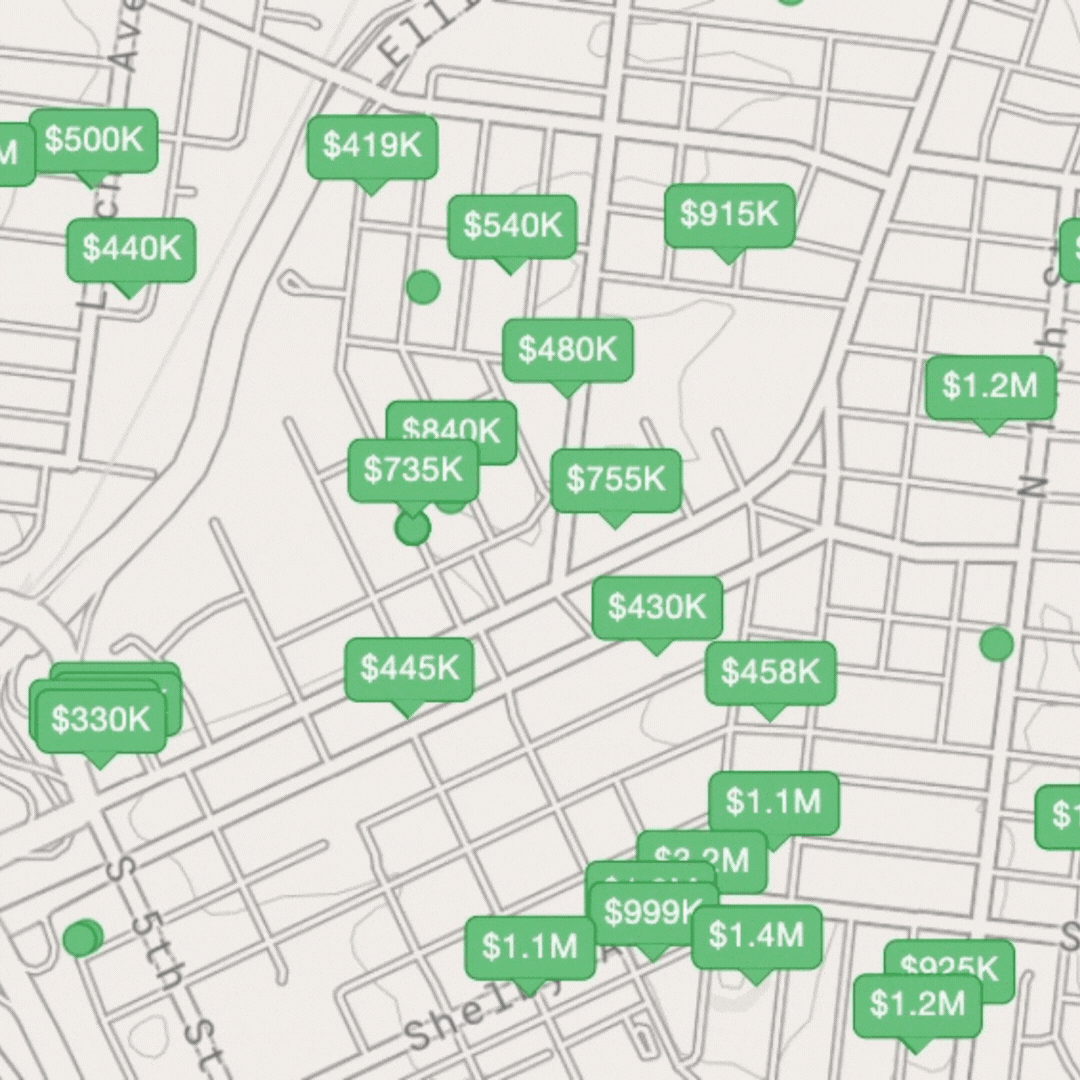
Lastly, we have the “Median Sold Price,” which is currently set at $532,000. This metric represents the middle point of all the sold prices in a given market. It provides an insight into the overall price range of properties being sold. With a median sold price of $532,000, it indicates that properties in this market tend to be in the mid-range price bracket.
To summarize, we can see that the real estate market has a moderate supply of inventory, with the number of listings increasing compared to the previous year. However, properties are still selling relatively quickly, and sellers are receiving offers close to their asking prices. The median sold price falls within the mid-range, suggesting that there is a wide variety of properties available at different price points.
By understanding these metrics, buyers can gauge the competitiveness of the market, and sellers can set reasonable expectations for their listing prices. Remember, experiences can vary greatly, so it’s always important to consult with a trusted real estate professional for personalized advice based on your specific location and circumstances.
Thank you for tuning in, and we hope this analysis has provided you with valuable insights into the current real estate market. Good luck with your future endeavors, and let us know if we can be of assistance.
Download Free Report