There are more homes for sale across Davidson, Williamson, Wilson, Rutherford, Sumner, Cheatham, Robertson, and Maury counties right now than at any point in at least the last five years. That's not a guess — it's what the data shows, county by county, going back to 2021.
But more homes for sale doesn't automatically mean more homes selling. That gap between supply piling up and demand keeping pace with it is the actual story in May's numbers, and it's worth understanding before you make a pricing or offer decision based on headlines alone.
The Snapshot: May 2026 vs. May 2025
Across our single-family market — the eight counties we work in directly — here's what changed year over year:
New listings fell 10%, to 4,869, while new contracts written rose 11%, to 2,801. Active inventory climbed 7%, to an average of 8,683 homes on the market at any given time. Closings were actually up 4%, to 2,654 — homes are still selling, just not at the pace new supply is arriving.
Prices kept climbing. Average sale price hit $749,768, up 7% from $700,332 a year ago and up from $687,059 two years ago. Median sale price came in at $529,900, up 4%. Homes took a bit longer to move — average days on market for closed sales rose from 28 to 32 days — but once a home went under contract, the path to closing actually got faster, dropping from 44 days to 41.
Months of supply landed at 4.09, up from 3.93 a year ago. That's still below the 5-to-6 month range that typically defines a balanced market, so this isn't a crash or a flip to buyers having all the leverage. It's a market loosening, not breaking.
The Real Story Is Underneath the Headline Number
Here's what the year-over-year comparison above doesn't show you: how we got here, and why inventory keeps climbing even though homes are still selling.
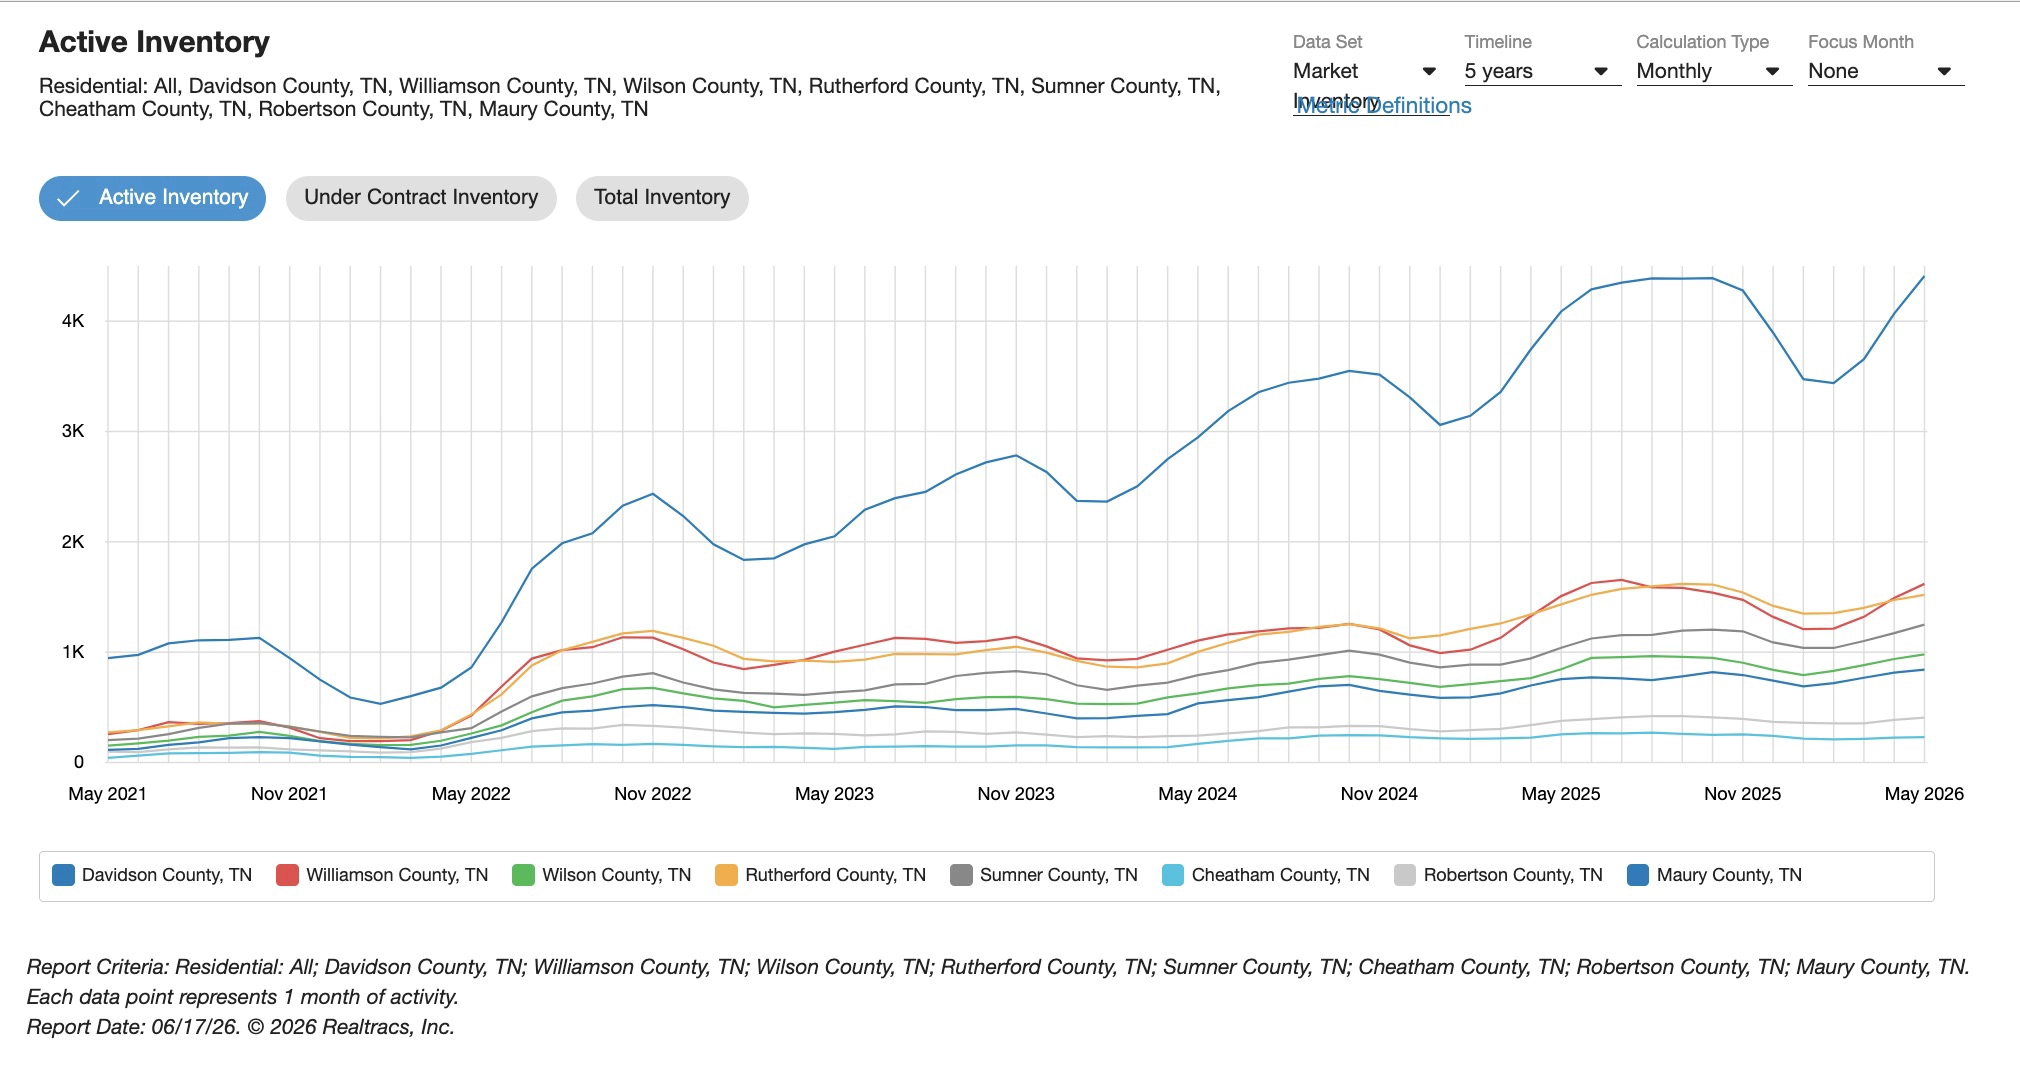
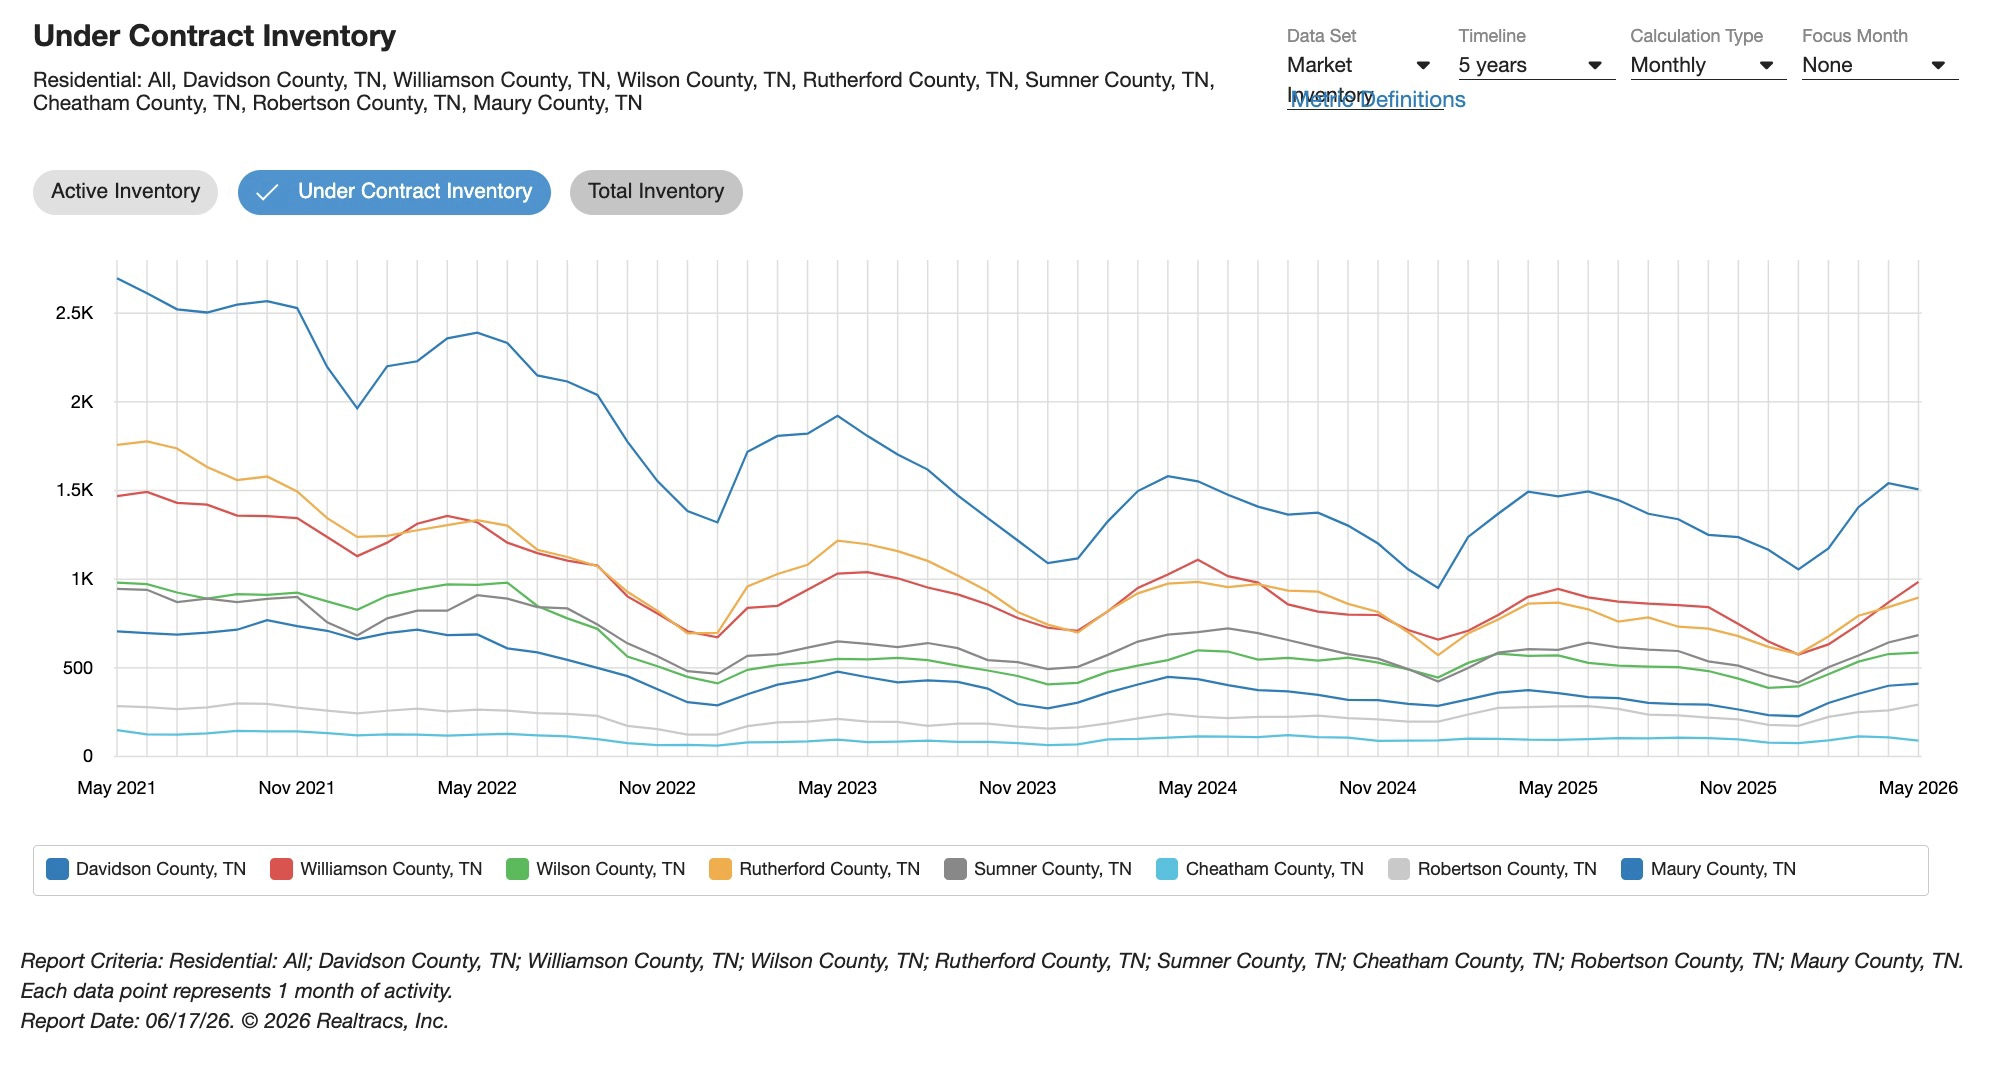
Look at Davidson County specifically — it's the largest market in our footprint by a wide margin, and tracking it over five years tells you more than any single month can. (This view includes all home types, not just single-family, since Davidson's urban core has enough condo and townhome stock that leaving it out would miss a real piece of the picture.)
Active inventory in Davidson has climbed every spring since 2022: from under 1,000 listings that May, to roughly 1,900 in 2023, around 2,400 in 2024, about 3,000 last year, and close to 4,500 this May. Five years running, the number of homes sitting on the market has gone up.
Pending sales tell a different story. Davidson's under-contract count was around 2,700 back in May 2021, fell to roughly 1,900 by 2023, dropped further to about 1,580 in 2024 — and then stopped falling. The last three springs have landed in essentially the same range, just above 1,500.
Put those two trends side by side and the disconnect is obvious. Supply has kept growing every year. Demand, measured by how many homes are actually moving into contract, found its floor a few years ago and has stayed there. Nobody collapsed — buyers didn't disappear. But the pace of new listings and unsold inventory has been outrunning the pace of contracts for several years running, and May's numbers are just the latest data point in that pattern, not a new development.
What This Means If You're Buying
You have more to choose from than you've had in years, and homes are sitting slightly longer before going under contract. That's leverage, but it's not unconditional. The homes that are still moving in 32 days or less are the ones priced and presented correctly from day one — the leverage shows up in negotiating concessions, repairs, and rate buydowns on those, not necessarily in the asking price itself. On a home that's been sitting for 90-plus days, you have a different and stronger conversation available to you. Worth asking your agent to check the listing history before you write an offer.
What This Means If You're Selling
The danger right now isn't that your home won't sell — closings are still up 4% year over year, so demand hasn't gone anywhere. The danger is getting lost in a more crowded market. With active inventory climbing every year since 2022, your listing isn't competing against last spring's market, it's competing against the cumulative pile-up. Pricing accurately and presenting well from the first day on market matters more in a market like this than in a tight one, because buyers now have other options to compare you against in real time.
By County: Where the Market Stands
A quick look at where prices and pace landed across our footprint in May:
- Davidson County: average sale price $811,959, median $550,000, 4.59 months of supply
- Williamson County: average sale price $1,364,144, median $1,104,222, 3.96 months of supply
- Wilson County: average sale price $601,314, median $550,000, 3.73 months of supply
- Rutherford County: average sale price $507,628, median $448,000, 3.35 months of supply
- Sumner County: average sale price $544,106, median $454,000, 3.94 months of supply
- Cheatham County: average sale price $432,553, median $399,000, 3.94 months of supply
- Robertson County: average sale price $432,056, median $381,000, 4.12 months of supply
- Maury County: average sale price $526,613, median $450,000, 5.18 months of supply
Maury's months of supply is the loosest in our footprint right now — worth watching if you're working that market specifically.
Bottom Line
Inventory is at its highest point in years, and pending sales haven't grown to match it — that gap, not any single monthly number, is what's actually driving this market right now. None of that means it's a bad time to buy or sell. It means the advantage goes to whoever understands which side of that gap their specific situation falls on.
We've been tracking Middle Tennessee's market for more than two decades and 500-plus closings, and we still pull the actual MLS data every month rather than reading the headline. If you want a read on what this means for your specific neighborhood or price point, that's a conversation, not a guess.
Frequently Asked Questions
Is Middle Tennessee a buyer's market right now?
Not yet. Months of supply sits at 4.09 across our core counties, below the 5-to-6 month range that typically signals a true buyer's market. It's a more balanced market than a year ago, not a reversal.
Why are there more homes for sale right now?
Active inventory has climbed every spring since 2022, while the pace of homes going under contract leveled off a few years ago. Supply has been outpacing demand's growth — not because buyers left, but because new listings and unsold homes have been accumulating faster than contracts have kept up.
Are home prices still going up in Middle Tennessee?
Yes. Average sale price across our core single-family market rose 7% year over year to $749,768, and median price rose 4% to $529,900.
How long are homes taking to sell in Middle Tennessee?
Closed listings averaged 32 days on market in May, up from 28 a year ago. Once a home goes under contract, though, the path to closing actually got faster — down to 41 days from 44.
Thinking about buying in this market? Let's talk about what your specific price range and county actually look like right now.
Schedule a Buyer ConsultationWondering what your home would sell for in today's market?
Get Your Home's FactsWant to dig deeper into a specific area? Start with our Nashville neighborhoods guide to find the in-town or suburban area that fits what you're looking for.
.png)
James and Stephanie Crawford have more than 22 years of experience and 500+ closed transactions across Middle Tennessee. As a husband-and-wife team running Nesting Realty, they handle every listing and every client personally — no hand-offs, no assistants closing deals on their behalf.