New - 1 Hour Ago


.png)
The latest Nashville market data reveals some encouraging shifts that both buyers and sellers should know about. Here's what's really happening in Music City's real estate scene.
Nashville's housing market is sitting pretty in what we'd call the "Goldilocks zone" right now. With a Market Action Index of 32, we're experiencing a slight seller's advantage - not the wild bidding wars of 2021, but not a full buyer's market either. Translation? Both sides can breathe a little easier and make thoughtful decisions.
After years of extreme seller advantage, Nashville's market has settled into a much healthier rhythm. Our Market Action Index of 32 puts us right at that sweet spot where neither buyers nor sellers have overwhelming leverage.
This is actually fantastic news if you've been waiting on the sidelines! Check out our latest spring market analysis to see how this trend has been developing throughout 2025.
Remember when Nashville homes would go under contract in 15-20 days? Those days are behind us, and honestly, we're not missing them!
Current Timeline:
This gives buyers actual time to:
For sellers, this means you need to be patient and price strategically from day one. Gone are the days of throwing any price on the market and watching offers roll in.
Here's a stat that tells the whole story: 42% of listings have had price decreases. That's nearly half of all homes currently on the market!
What this means:
Only 1% of listings have increased their prices, while 22% have been relisted. This market rewards realistic pricing and punishes wishful thinking.
Looking at our market segments, the $575,000 price point is where the magic happens. Homes in this range (around 2,000 sq ft, 3 bed/2.5 bath, 19 years old) are selling in just 56 days - significantly faster than the overall market average.
This price range perfectly aligns with some of Nashville's most desirable neighborhoods! Our comprehensive neighborhood guide shows this hits the sweet spot for areas like:
Explore East Nashville's unique neighborhoods to see why this area consistently performs well in this price range.
Each segment represents about 25% of Nashville's market, and the performance varies dramatically:
Browse current market reports by county to see how these segments perform in your target area.
With 1,936 homes available, inventory remains limited but steady. We're not seeing the dramatic shortages of 2020-2022, but there's still not enough supply to tip us into a full buyer's market.
What this means:
The data suggests we've reached a relative equilibrium. However, with inventory still sufficiently low, we remain in seller's market territory. Keep an eye on the Market Action Index - if it climbs above 40, we could see prices resume their upward climb.
Key factors to watch:
If You're Buying:
If You're Selling:
Thinking About Nashville?
Whether you're drawn to the creative energy of East Nashville, the family-friendly suburbs, or anywhere in between, this market offers opportunities for both buyers and sellers who understand the current conditions.
Questions about how these trends affect your specific situation? We'd love to help you navigate Nashville's market with confidence. After 21 years of helping families find their perfect Nashville home, we know that understanding the data is just the beginning - it's how you apply it to your unique situation that makes all the difference.
📞 Call us at (615) 751-8913 or email [email protected]
Market data reflects single-family homes in Davidson County as of August 13, 2025. Information sourced from Altos Research via RealTracs MLS.

When you're ready to buy or sell a home in Nashville, having experienced local guides makes all the difference. As a husband-and-wife realtor team with deep roots in Music City, we've helped hundreds of families navigate Nashville's unique real estate landscape. We believe every client deserves personalized service backed by decades of local market expertise.Nashville's real estate market has fou

Inheriting property in Nashville can feel overwhelming, especially while you're already dealing with the loss of someone you love. Whether it's a family home in Brentwood, a Donelson ranch your parents downsized into, or an investment property in East Nashville, here's what the process actually looks like — and the decisions you'll need to make along the way.We've walked a number of Middle Tennes
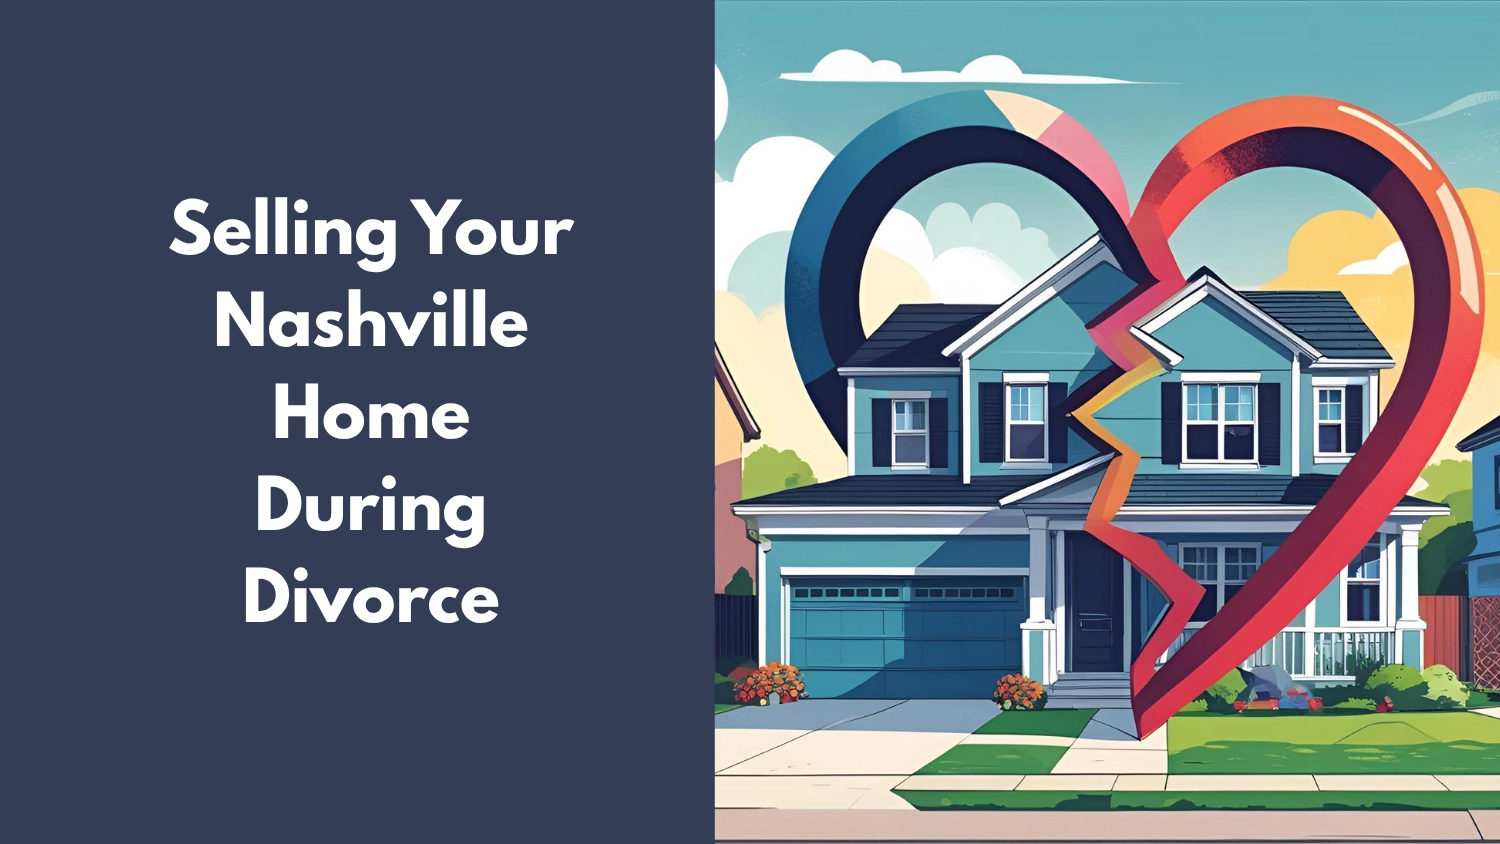
Going through a divorce is one of life's most stressful experiences, and adding the complexity of selling your family home can make it feel overwhelming. As Nashville realtors with specialized training in divorce real estate, we have helped countless couples navigate this challenging process over our 21 years in business. Stephanie holds the Real Estate Collaboration Specialist - Divorce (RCS-D)

Are you considering moving to Nashville, TN? You’re certainly not alone. Greater Nashville continues to attract new residents from across the country, drawn by job opportunities, culture, and a lifestyle that still feels more approachable than many major metros.That said, moving to Nashville in 2026 looks different than it did just a few years ago. The city is still growing, but housing costs, t